FINANCE

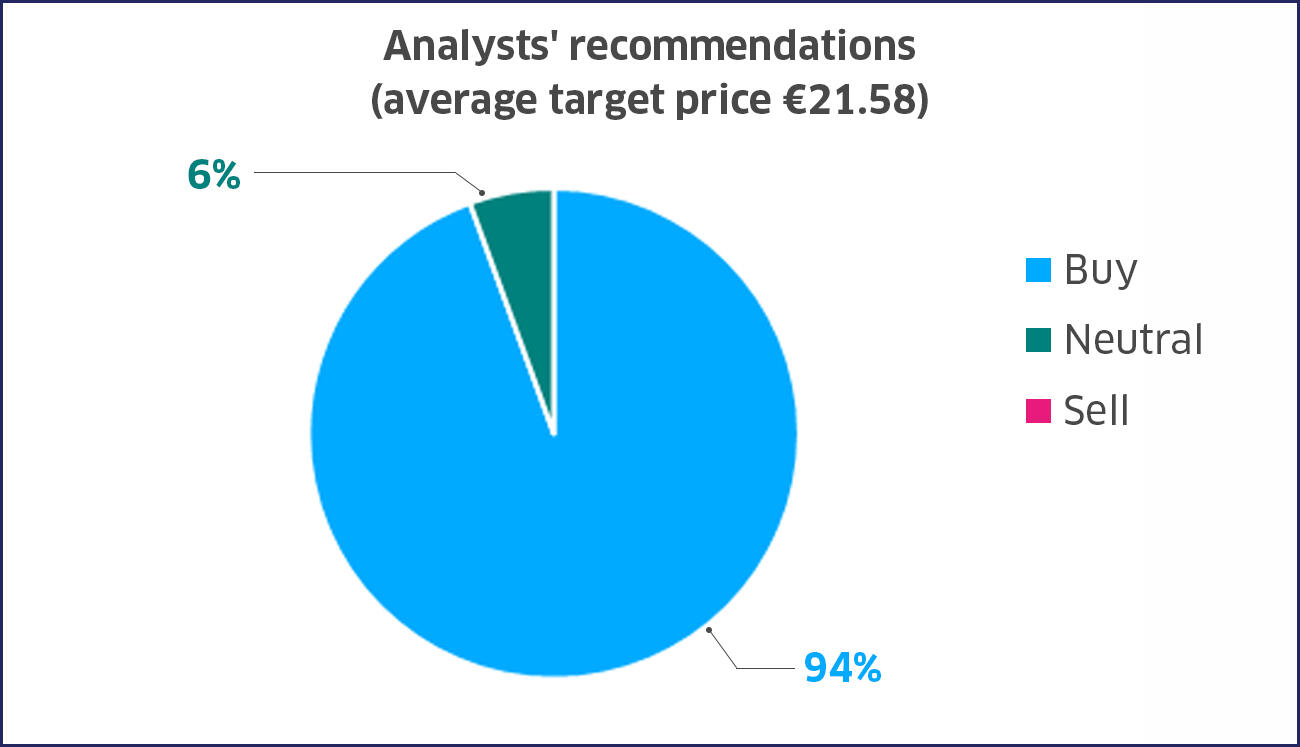
Consensus for ENGIE (at October 29, 2025)

The following is a consensus consisting of independent analyst forecasts, compiled by the issuer that does not issue any opinion on it.


Disclaimer

The data presented set out a summary of the recommendations, target prices and financial estimates published between September and October 2025 by the financial analysts that, to the knowledge of ENGIE, cover ENGIE shares and issue dedicated reports from which are extracted such data. Reference to these data serves only for reader information and is non-binding. These data may not be regarded as a solicitation or an offer to buy or to sell ENGIE shares. These data have been established by financial analysts under their own responsibility and do not reflect the opinion of ENGIE. ENGIE does not issue any opinion and does not give any warranty as to the accuracy and quality of these data which come from financial analysts. No warranty is given as to their completeness and ENGIE does not commit to update them.

Consensus 10 29 2025
FY 2025e [M€]EBITDA excl.
Nuclear
EBIT excl.
Nuclear
Net Recurring Income 
Group share incl. 
Nuclear
Average13.6358.7064.762
Median13.5628.6904.795
Lowest13.2358.4724.442
Highest14.6939.0294.926
# estimates101010


FY 2026e [M€]EBITDA excl.
Nuclear
EBIT excl.
Nuclear
Net Recurring Income 
Group share incl. 
Nuclear
Average13.9358.8684.502
Median13.8588.8764.531
Lowest13.4888.5494.226
Highest14.5709.2004.650
# estimates101010


FY 2027e [M€]EBITDA excl.
Nuclear
EBIT excl.
Nuclear
Net Recurring Income 
Group share incl. 
Nuclear
Average14.4939.2614.670
Median14.4599.3114.699
Lowest13.7118.5494.356
Highest15.2089.6894.935
# estimates101010